User interface
The SPA uses a unified dashboard layout: a top bar for global actions, a sidebar (SubNav), and tabbed main content. Screenshots below show the live Web UI in English (LTR). Other locales use the same layout with translated labels—see the matching 03-user-interface chapter per language.
Changing the language in the top bar updates menu labels, tab titles, internal data-source names, and CVE text direction when translation is enabled.
Layout regions
The top bar shows stack tool count, language selector, theme toggle (light / dark / system), live watch, alerts, auto-refresh, and full scan. The Export control is a keyboard-accessible menu (CSV, JSON, print) with Escape and click-outside dismiss; CSV adds EPSS, risk score, type, version fields, truncated description, and aliases plus a header comment for scan date and stack; JSON wraps findings in an envelope with exported_at, stack, sources, and totals. Print uses a dedicated stylesheet that hides navigation chrome. On narrow viewports, a menu button opens SubNav as a drawer.
SubNav includes the product title, live-watch badge, main navigation, stack tools with CVE counts, quick severity filters (on the Vulnerabilities tab), data sources with last updated timestamps, and a scan summary by severity. Collapse narrows the sidebar to icons only.
| Tab | Purpose |
|---|---|
| Dashboard | Metrics, charts, critical list, clickable tool cards |
| Vulnerabilities | Search, filters, expandable CVE cards |
| Live Watch | Watch interval, countdown, new CVEs since full scan, poll history |
| Scan history | Trend chart and recent scans (PostgreSQL, tenant-scoped) |
| Infrastructure | Stack editor, settings sub-nav (sources, notifications, ops, tenants, appearance) |
Alerts tab removed
The separate alerts history tab was removed; new findings still appear via banner and toast notifications.
Dashboard
After a full scan, the dashboard shows severity summary, distribution charts, affected tools, and critical CVEs. KEV / exploited and patch available metrics summarize exploitation and remediation signals. A source health panel lists each feed from the last scan (sources_checked / sources_failed). Tool cards show per-service KEV and patch counts. Clicking a tool card jumps to Vulnerabilities with that tool filter applied.
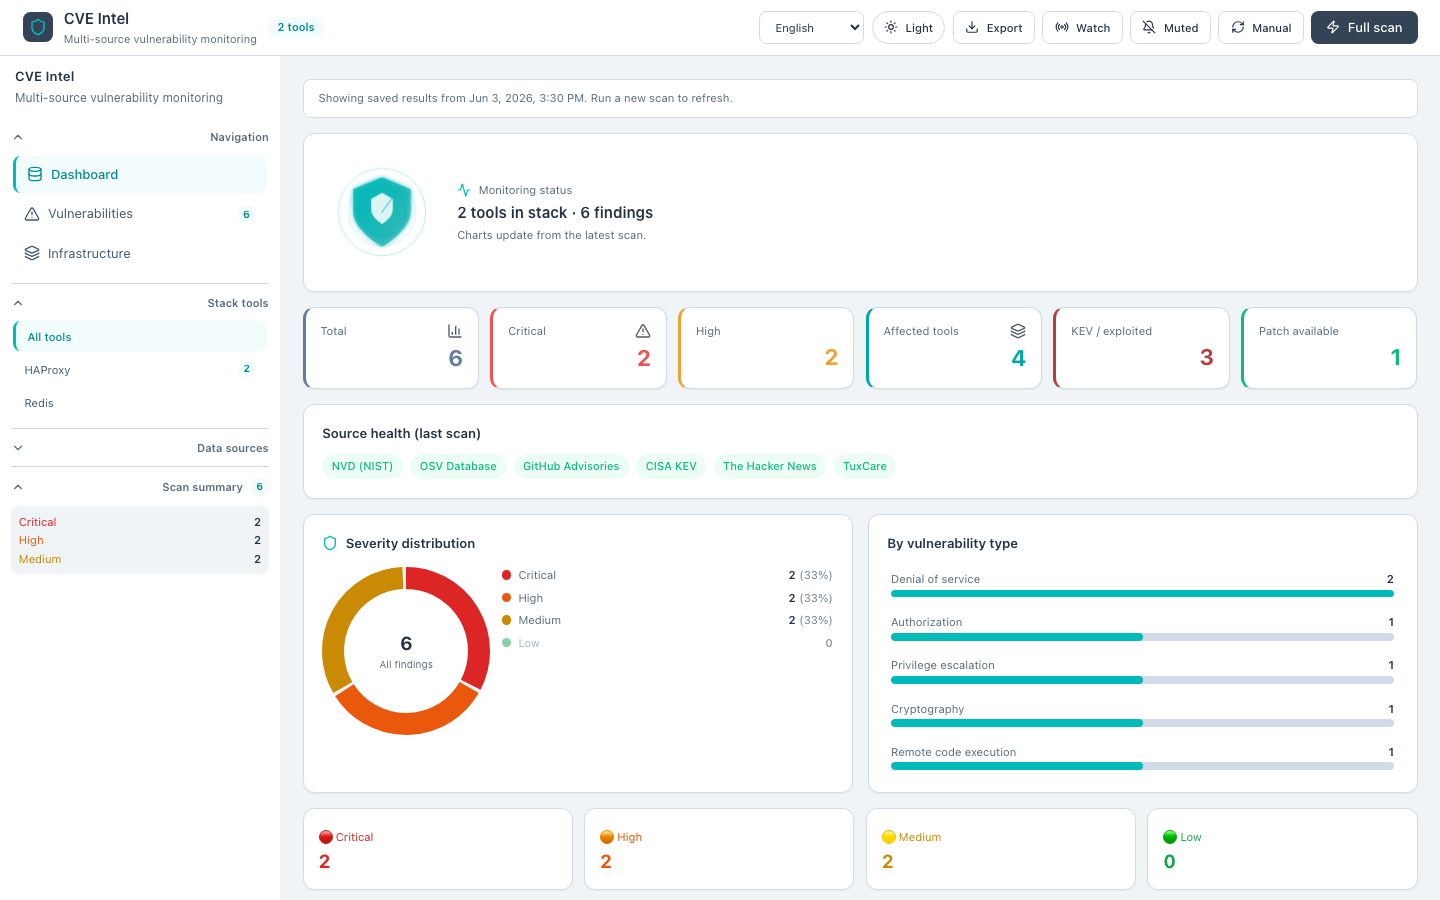 Figure 1 — Dashboard after scan (English, light theme)
Vulnerabilities tab
Sticky filter bar with text search, multi-select severity chips, type / tool / multi-source filters, KEV, optional min EPSS and published date range, sorting (EPSS / risk score), URL-synced query params (?severity=critical&kev=1), tenant-scoped saved views in localStorage, and expandable cards (touch-friendly spacing on small screens). CVE cards show separate EPSS and risk score badges when enrichment data is present. Clicking severity, type, source, or KEV tags on a card applies the matching filter in this tab. When merge deduplicates the same CVE across sources (for example NVD + GitHub), alternate IDs (GHSA, PYSEC, etc.) appear as monospace chips in the expanded card body with forced LTR direction.
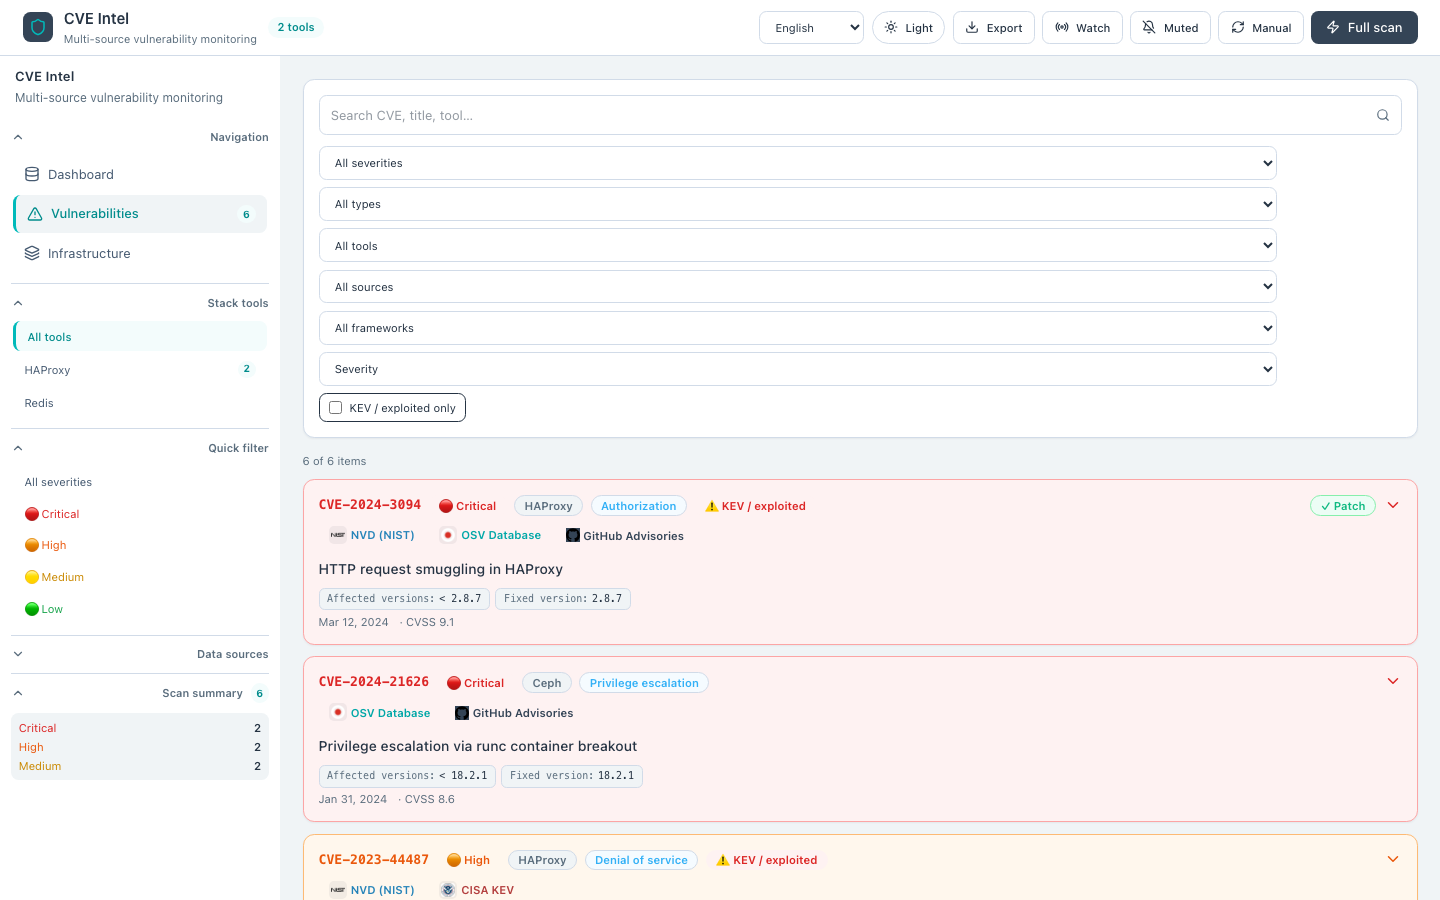 Figure 2 — Vulnerabilities tab with filters and cards
Infrastructure tab
The Infrastructure main tab hosts long-lived configuration: stack tools, scan behavior, data sources, notification visibility, and display preferences. A horizontal settings sub-nav switches between sections without leaving the tab. Values persist in browser localStorage under the cve-radar:* prefix. When PostgreSQL is enabled, Ops and Tenants expose server session metadata and per-tenant stacks.
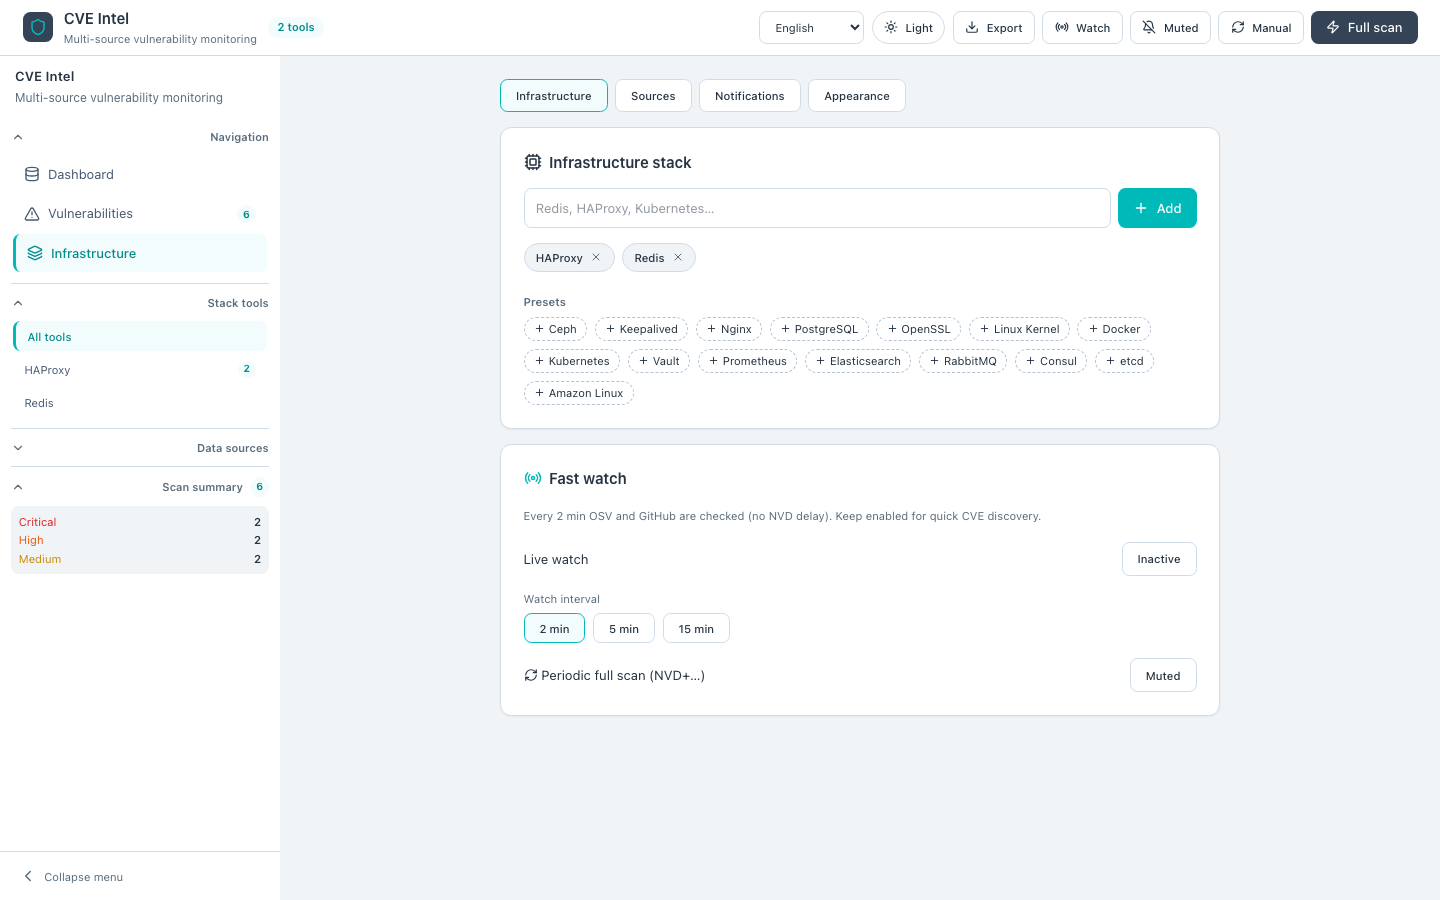 Figure 3 — Infrastructure sub-nav: stack and fast watch (English)
| Sub-nav section | What you configure |
|---|---|
| Infrastructure | Stack tools, infra presets, live watch interval, periodic full scan |
| Sources | Built-in CVE feeds and custom RSS |
| Notifications | Server channel status (read-only), browser toast/banner alerts |
| Ops | Runtime API key, session (RBAC role, tenant, multi-tenant flag), health, metrics, audit log |
| Tenants | Active tenant slug, create tenant, saved stacks (load / edit / delete), notification prefs |
| Appearance | UI language, font scale, theme, CVE auto-translation |
Sources
The Sources section lists every built-in feed the scan engine can query: NVD, OSV, GitHub Advisories, GitLab Advisory Database, CISA KEV, The Hacker News, TuxCare, Alpine secdb, Ubuntu USN, Red Hat Security, Debian Security Tracker, and Amazon Linux ALAS. Each row shows a brand icon and a checkbox—disabled feeds are skipped on the next full scan or watch cycle.
Custom RSS feeds sit below the built-in list. Click Add custom feed to append a card with enabled, display name, and feed URL (LTR). Remove unwanted feeds with the trash control. Custom entries use the custom:{uuid} source id internally; only feeds with a non-empty URL participate in scans.
Source choices are stored in cve-radar:source-config and mirrored in setup wizard step 3 for new users. The SubNav sidebar lists each enabled source with last updated timestamps from the most recent scan meta.
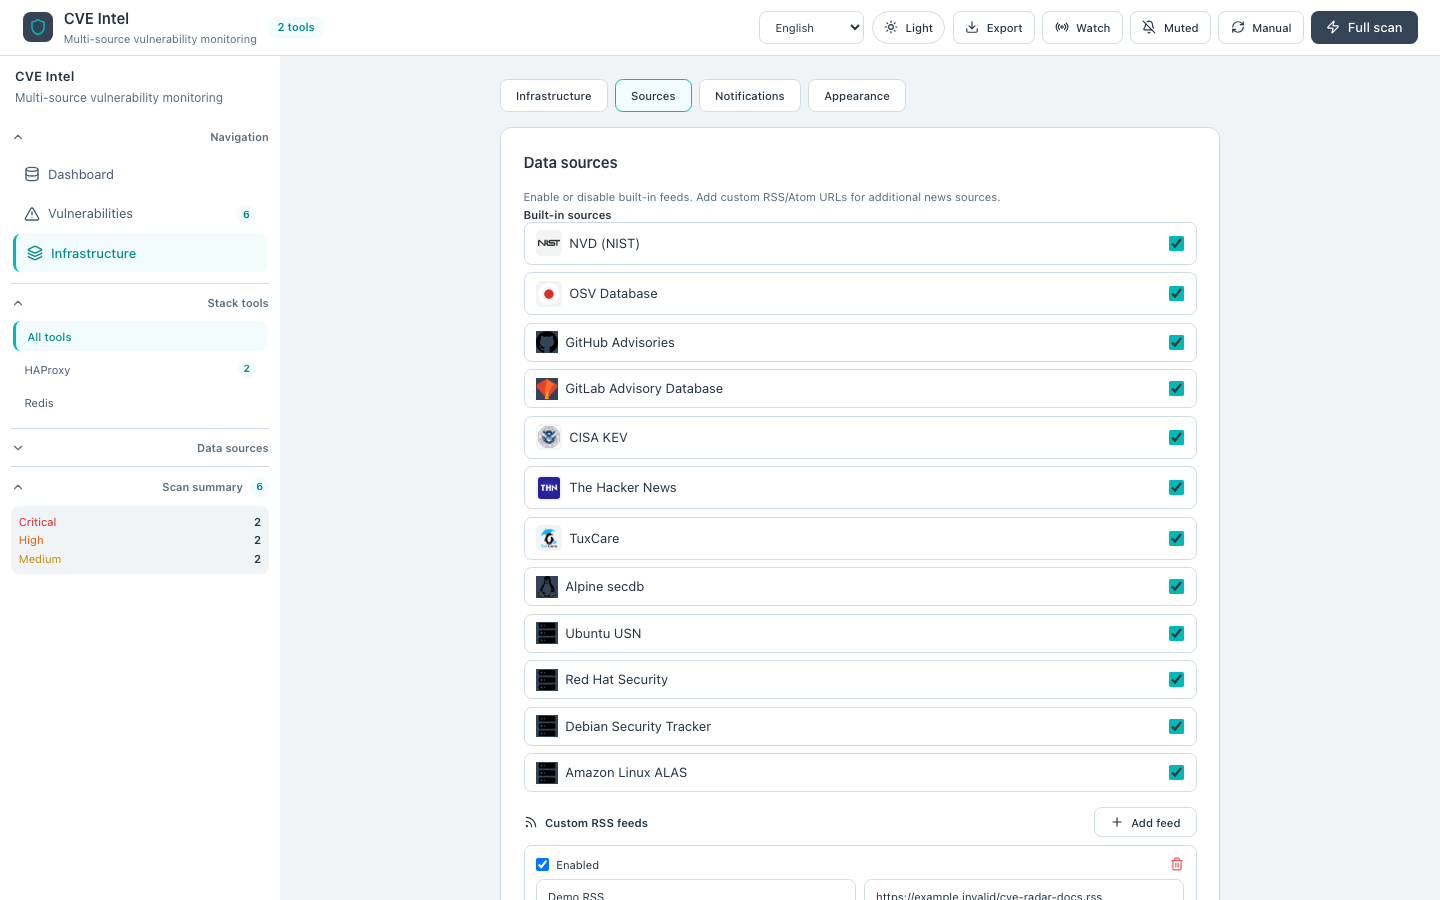 Figure 3a — Sources: built-in toggles and custom RSS
Notifications
The Notifications section splits into server channels (with per-channel setup guides) and browser alerts.
Server-side dispatch (Slack, Discord, Microsoft Teams, Telegram, e-mail, generic webhook) is configured on the API host via environment variables — secrets never enter the browser. The panel calls GET /api/health?detailed=true and shows each channel as Configured or Not configured, plus the global minimum severity threshold. Click a channel row to expand the setup guide: numbered steps, required/optional env var names, and a Copy example snippet for .env. After editing server secrets, restart the API process and click Refresh.
| Channel | Required env (summary) |
|---|---|
| Slack | NOTIFICATION_SLACK_WEBHOOK_URL (or legacy ALERT_WEBHOOK_URL) |
| Discord | NOTIFICATION_DISCORD_WEBHOOK_URL |
| Microsoft Teams | NOTIFICATION_TEAMS_WEBHOOK_URL |
| Telegram | NOTIFICATION_TELEGRAM_BOT_TOKEN, NOTIFICATION_TELEGRAM_CHAT_ID |
| Email (SMTP) | NOTIFICATION_SMTP_HOST, NOTIFICATION_SMTP_FROM, NOTIFICATION_SMTP_TO |
| Generic webhook | NOTIFICATION_WEBHOOK_URL |
See also Self-hosted notifications for production notes, dedup, and per-channel severity/rate limits.
Browser alerts are client-only: enabling Toast / banner alerts (also toggled from the top bar bell) shows in-app toasts and the new-findings banner when watch or scan detects fresh CVE IDs. The panel displays Notification API permission (granted, denied, default, or unsupported) and offers Request permission when the browser has not decided yet.
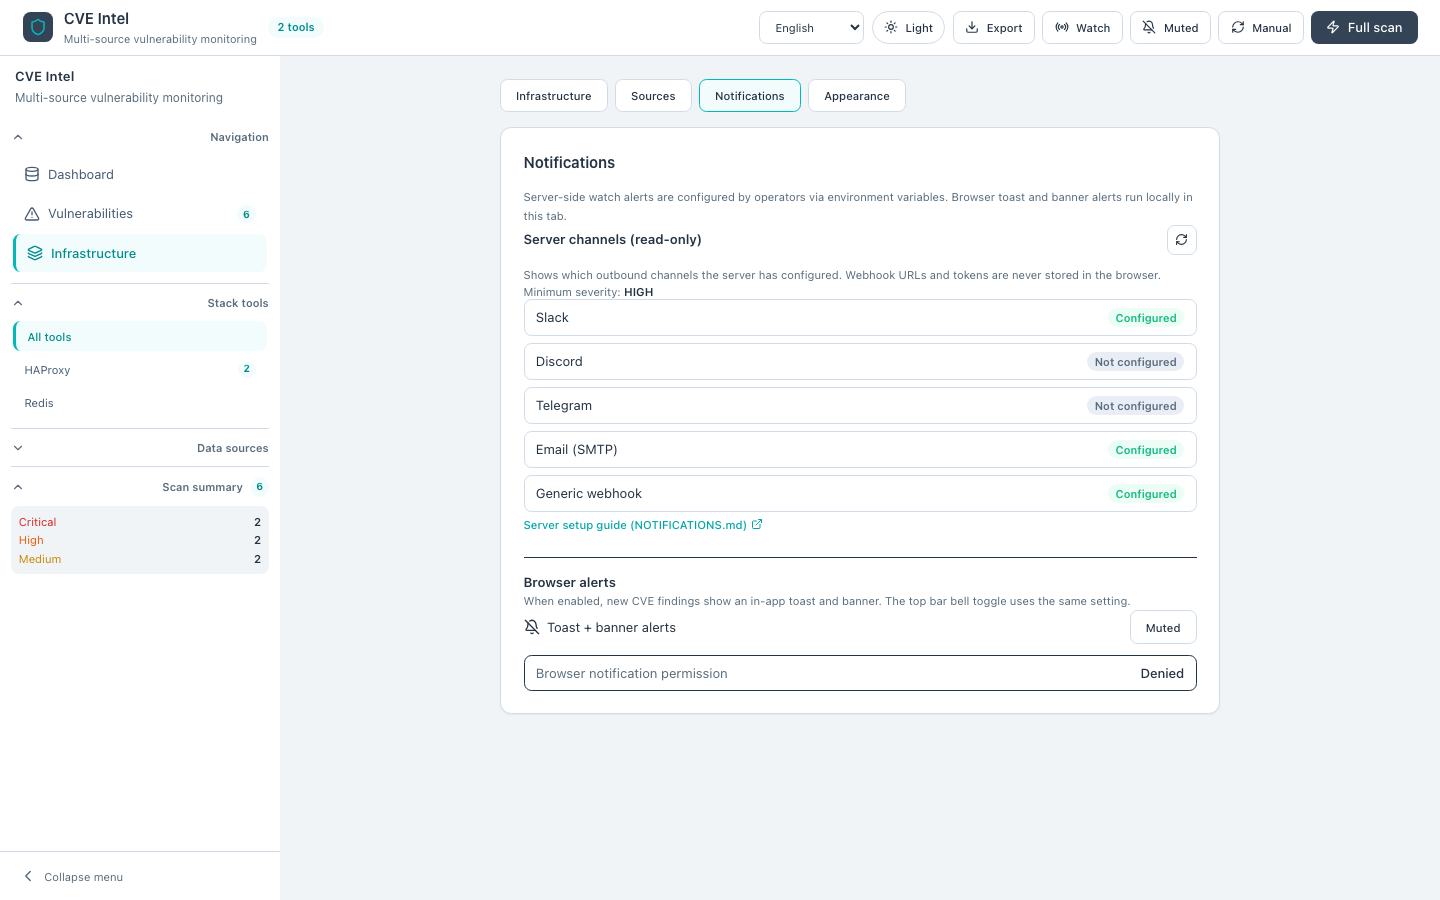 Figure 3b — Notifications: channel list (not configured until server env is set)
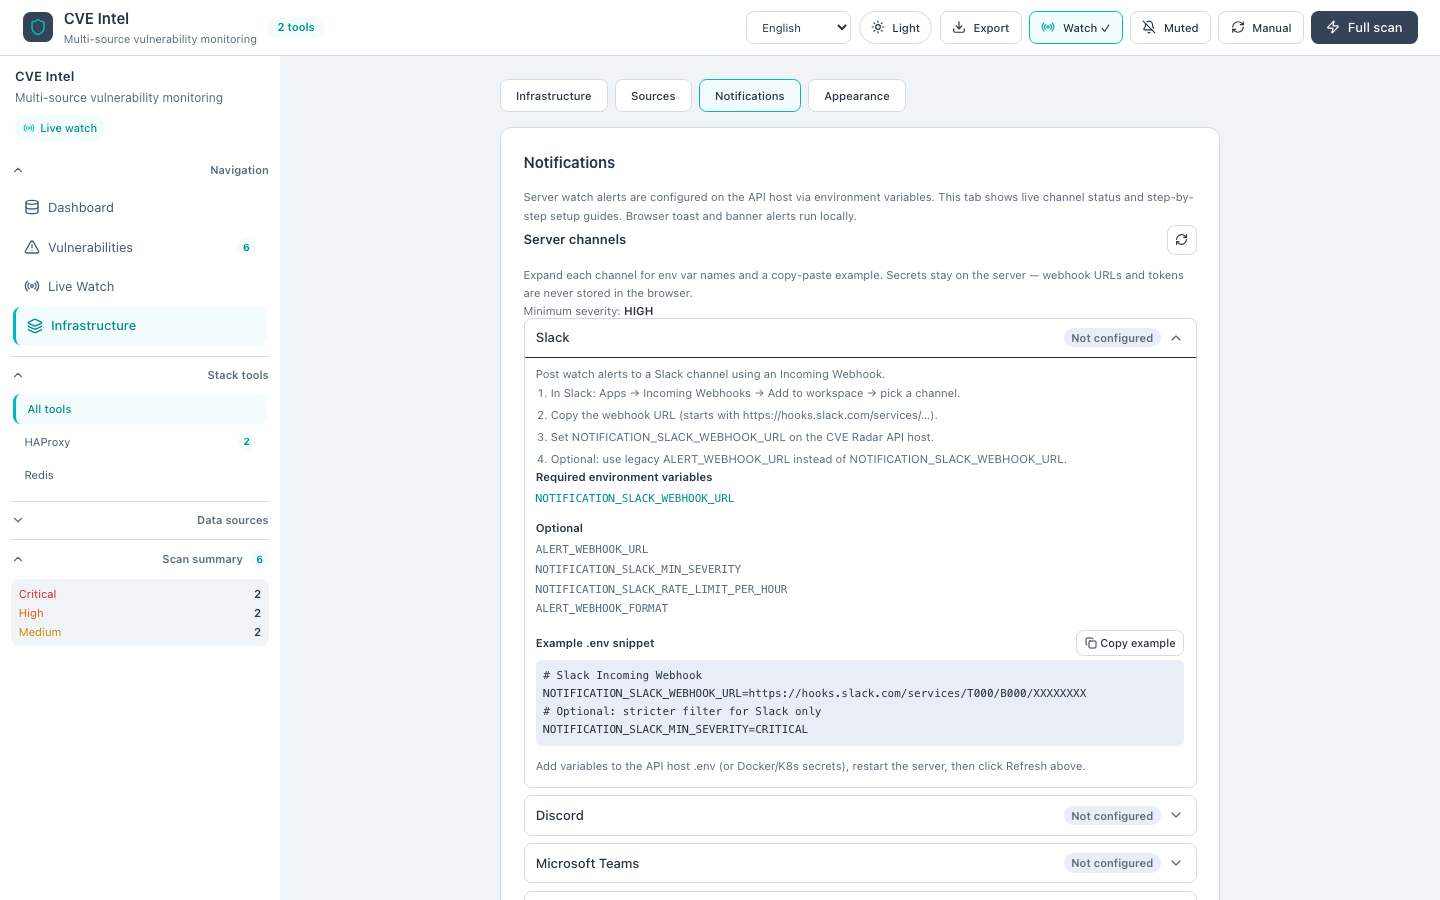 Figure 3b2 — Expanded Slack setup guide with env example and copy control
Appearance
Appearance groups display settings that do not affect scan logic:
- Language — English, Persian, Arabic, Russian, Chinese, or French; updates labels, SubNav source names, and CVE text direction (RTL for fa/ar).
- Font scale — steps 85%–140% via +/− (
cve-radar:font-scale). - Theme — light, dark, or system (
cve-radar:theme); dark mode uses teal accents on navy backgrounds. - CVE auto-translate — when enabled, the server enriches titles and descriptions to match the active UI locale during scan.
The top bar still exposes language and theme for quick access; changes stay in sync across both locations.
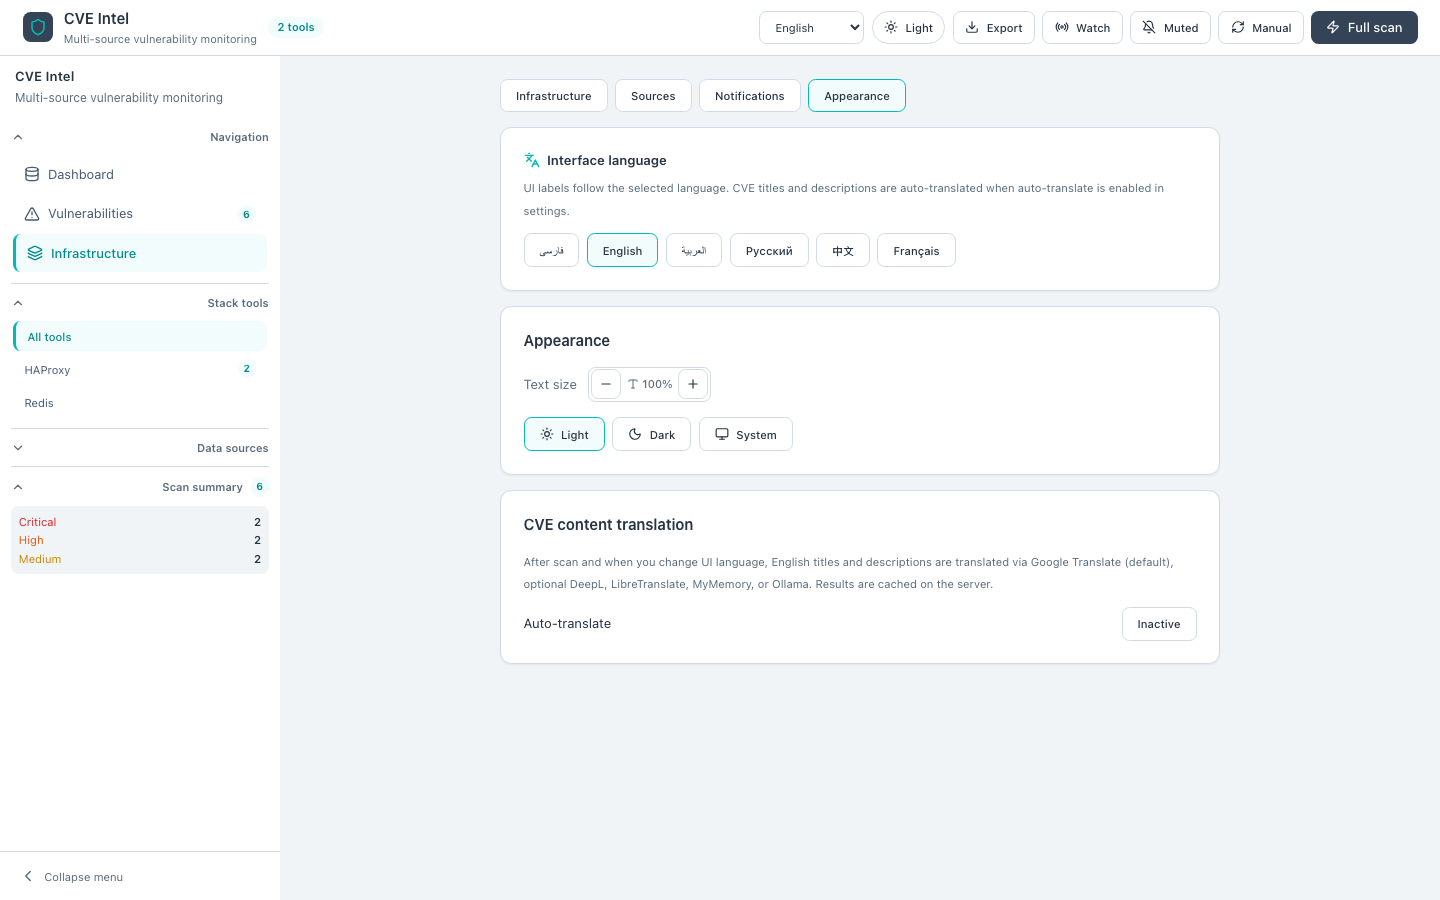 Figure 3c — Appearance: language, font scale, theme, translation
Ops
The Ops section stores an optional API key in the browser (X-Api-Key on /api/v1/*). When the server has OIDC_ISSUER and OIDC_CLIENT_ID, a Sign in with SSO button starts the authorization-code + PKCE flow; the callback path is /auth/callback. Access tokens are stored locally and sent as Authorization: Bearer. It calls GET /api/v1/session to show multi-tenant mode, RBAC role, active tenant (from X-Tenant-Id), and whether API auth is enabled. Runtime features mirror /api/capabilities; System health mirrors detailed health including database multi-tenant flag. Prometheus metrics links to /metrics. Recent audit events lists tenant-scoped buffer rows with timestamp, action, mode, counts, client IP, stack preview, and sources_failed.
Tenants
When DATABASE_URL is set, Tenants lets operators switch the active tenant slug (stored locally and sent as X-Tenant-Id), create tenants, and manage saved stacks per tenant: save the current stack, load into the editor, edit name and tools inline, or delete. Per-tenant notification preferences and optional channel webhook overrides use the same panel. Notification test requests include X-Tenant-Id so dispatch respects tenant overrides.
Scan history tab
The Scan history tab (SubNav) requires PostgreSQL on the server. It shows a vulnerability trends bar chart and recent scans for the active tenant (X-Tenant-Id). Each row includes scan mode, severity counts, full stack tool list, and any sources failed from that run. When the database is disabled, the tab explains that DATABASE_URL is required.
Live Watch tab
The Live Watch tab (SubNav rail, between Vulnerabilities and Infrastructure) surfaces fast OSV/GitHub polling without a full scan. Polls call POST /api/v1/watch with X-Tenant-Id so watch history persists under the active tenant. When watch is active, a countdown shows time until the next poll; the interval selector (2 / 5 / 15 min) writes to settings.watchIntervalMs. New since last full scan lists compact CVE rows discovered via watch; the badge on the tab shows the count. Watch poll history keeps the last 20 poll results with timestamp and new-CVE count. Toggling watch here or from the top bar stays in sync; a successful full scan (POST /api/v1/scan/stream) clears the “new since scan” list.
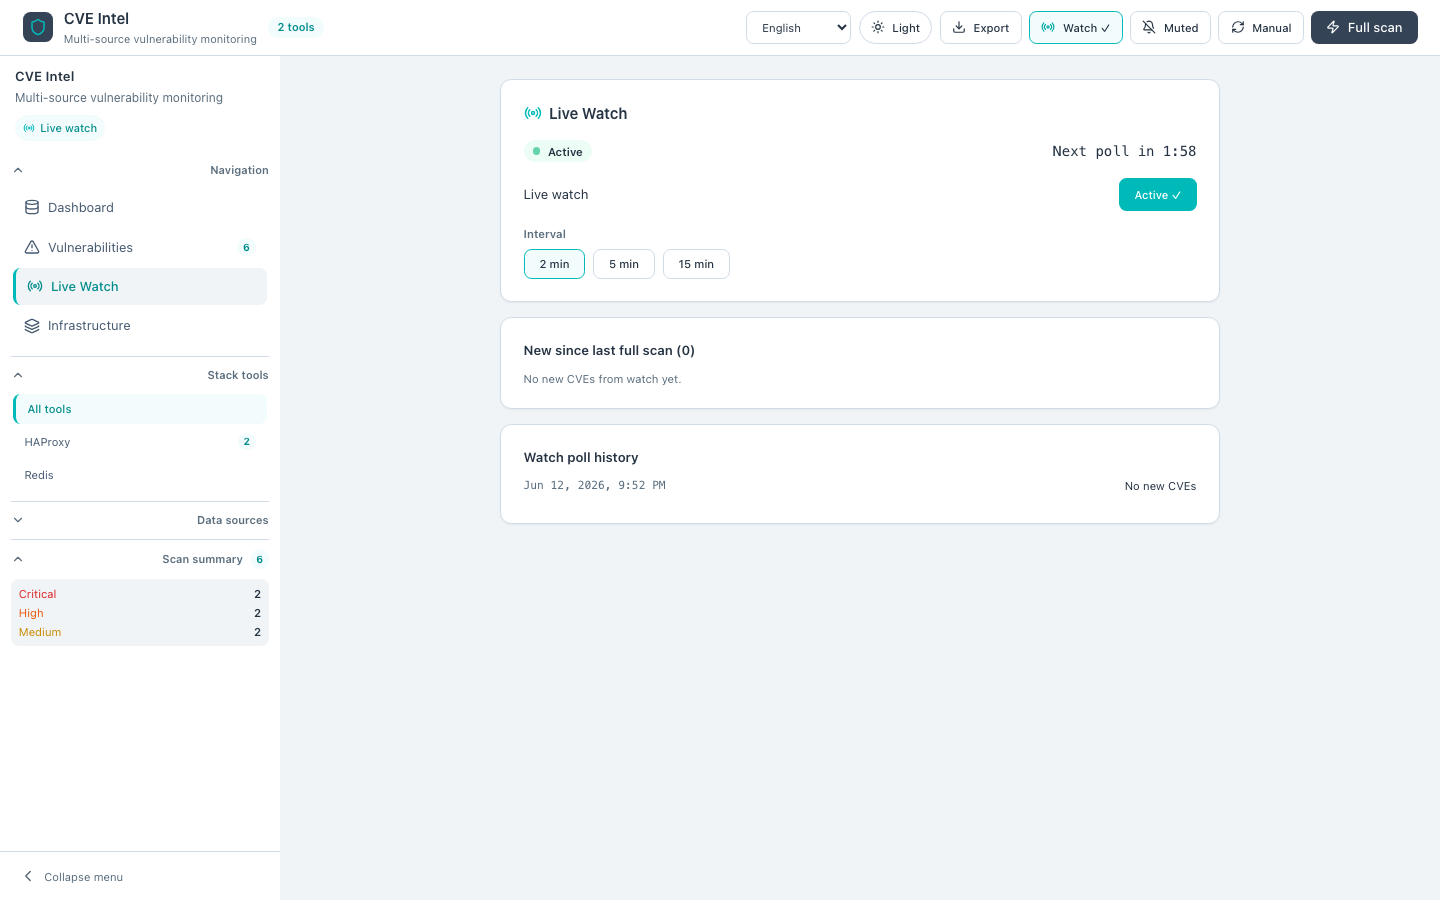 Figure 3d — Live Watch: countdown, interval, new CVEs, poll history
Scan splash
Starting full scan opens a full-screen overlay. While SSE progress events arrive, each data source appears as a row with a pulsing dot (active), green dot (done), and the current stack tool when applicable; the overall percent bar still reflects ScanProgressEvent.percent. Before the first event, the splash falls back to static step labels (NVD → OSV → GitHub → …). When finished, the app returns to the dashboard automatically.
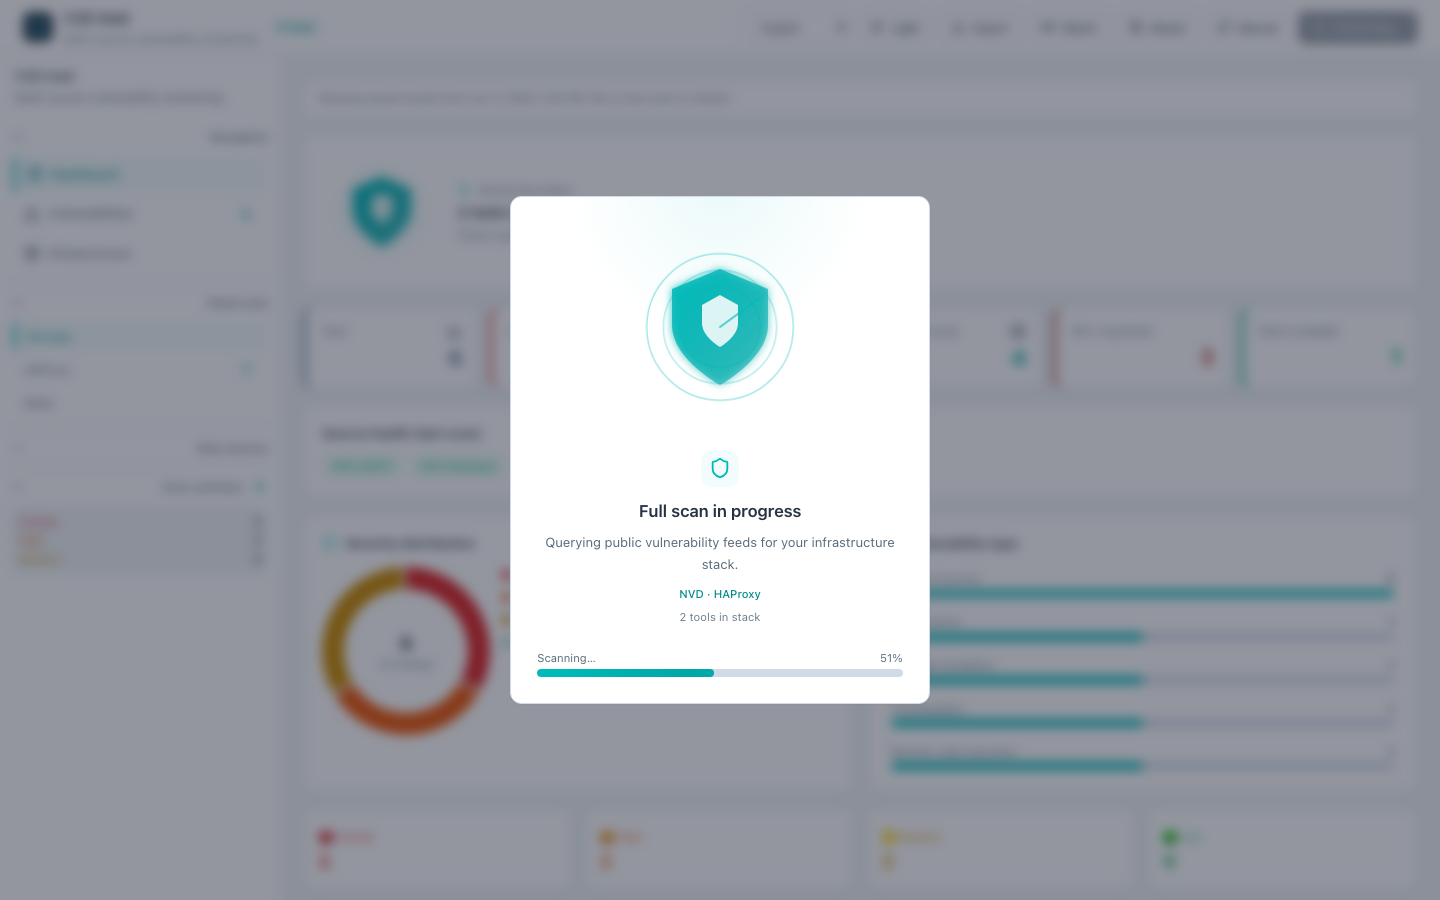 Figure 4 — Scan splash while a full scan is running
First-run setup wizard
After the disclaimer, new users see a full-screen four-step wizard:
- Stack — add tools or apply infrastructure presets.
- Settings — alerts, live watch, interval, optional translation.
- Sources — enable or disable built-in feeds and custom RSS.
- Finish — optional first full scan; sets
cve-radar:setup-complete.
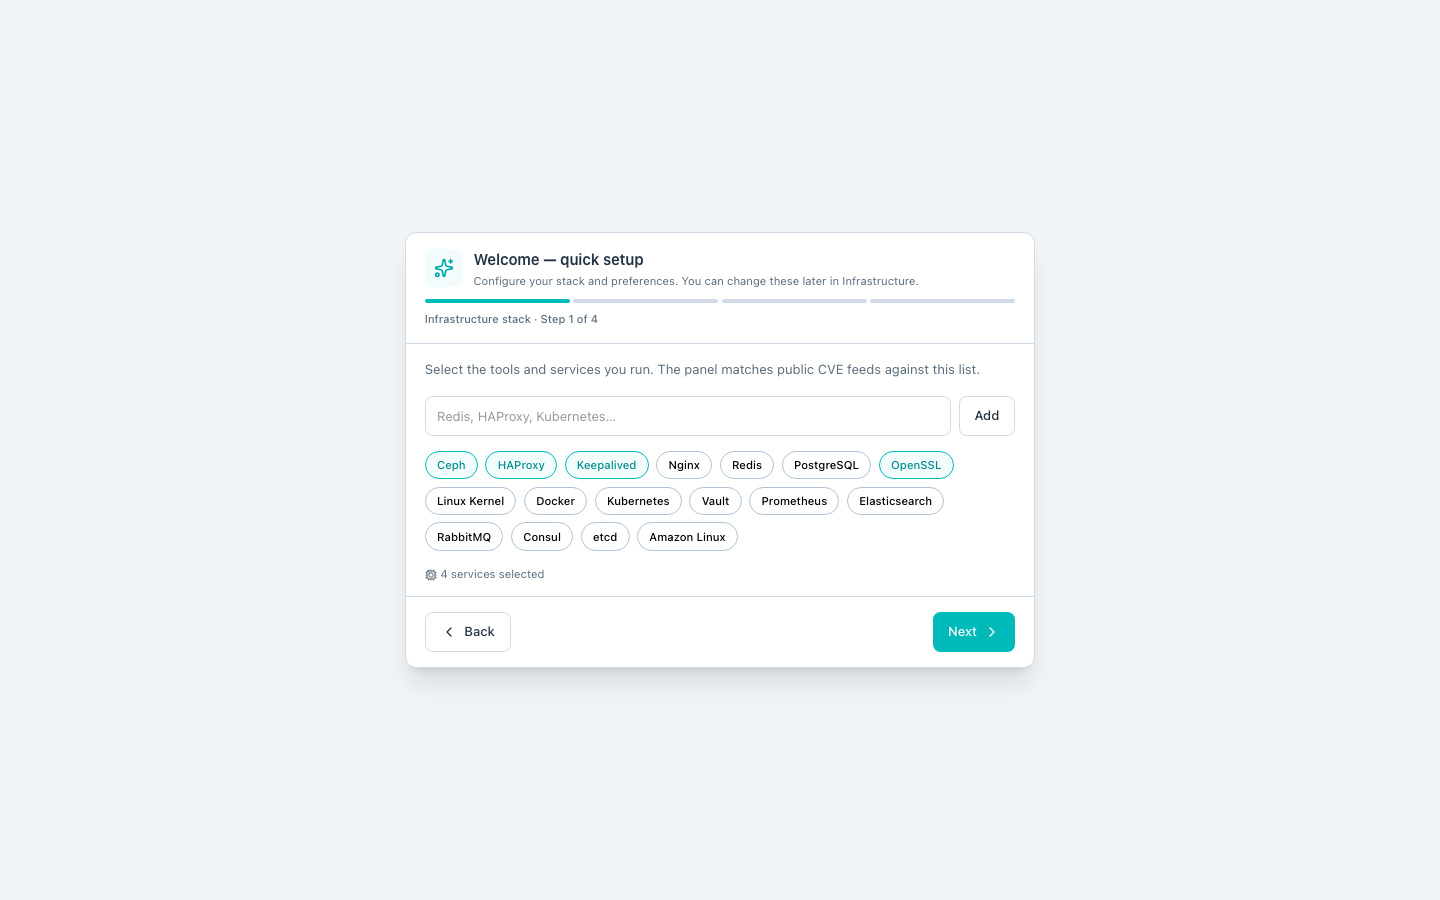 Figure 5 — First-run setup wizard, stack step (English, light theme)
Returning users skip the wizard when setupComplete is already set.
Cached scan results
When the app loads a previous scan from localStorage (same stack key), the dashboard shows a cached results banner with the saved scan date. Run Full scan from the top bar to refresh live data from the API.
Tool-centric navigation
Clicking a tool card on the dashboard (or a tool name in SubNav) switches to Vulnerabilities, sets the tool filter, clears other filters, and shows the complete matching list without pagination.
Font scale and themes
See Appearance under the Infrastructure tab for font scale (85%–140%), themes (light / dark / system), and CVE auto-translate. Dark mode uses teal accents (#20c5ba) on deep navy backgrounds.
Mobile
Below the md breakpoint the sidebar is hidden; use the header menu to open the full SubNav overlay.
Next: Scan & watch